Trending-product buy list · TikTok + Instagram × Hotspex emotion
Stock the hottest trends — before they're everywhere.
A buy list to compete with Showcase. 500 socially-trending impulse products —
gadgets, novelties, problem-solvers — each scored two ways: trend momentum
(velocity and acceleration, not lagging volume) and the Hotspex emotional connection
that actually drives the unplanned purchase. Blended into one Idea Score.
Idea Score = 0.45 × trend momentum + 0.55 × emotional connection.
Emotion is weighted higher because for impulse retail the emotional trigger is what converts the
unplanned buy — trend momentum just gets the product discovered. Filter, search, and re-sort below.
loading…
#
Product
Category
Lead
Trend
Hotspex zone · core emotions · right-space
Emotion
Idea
Est. ON demand /yr
Buy rationale
Trend momentum: per-platform velocity (Δ engagement) + acceleration (Δ velocity) across three
windows, converged across TikTok + Instagram, normalised 0-100. Emotional connection: each product
placed on the Hotspex Emotion Map, scored 0-100 on how strongly and distinctively it fires its
dominant driver. Same engine as the Python build, ported to JS.
Est. ON demand: a MODELED annual unit estimate (low–high band), not measured sales. Method:
~6.2M Ontario households (3.6M pet-owning) × category penetration × trend-heat multiplier
(0.4–1.8×) × emotional-conversion multiplier (0.75–1.25×). Treat as directional sizing to
validate against real search and point-of-sale data before committing buy quantities.
Hotspex emotion map · the predictive layer
What each product makes a shopper feel
Trend tells you what's moving. Emotion tells you what will sell and repeat. Every product
is placed on the canonical Hotspex Personality Wheel — eight emotional zones, each with its
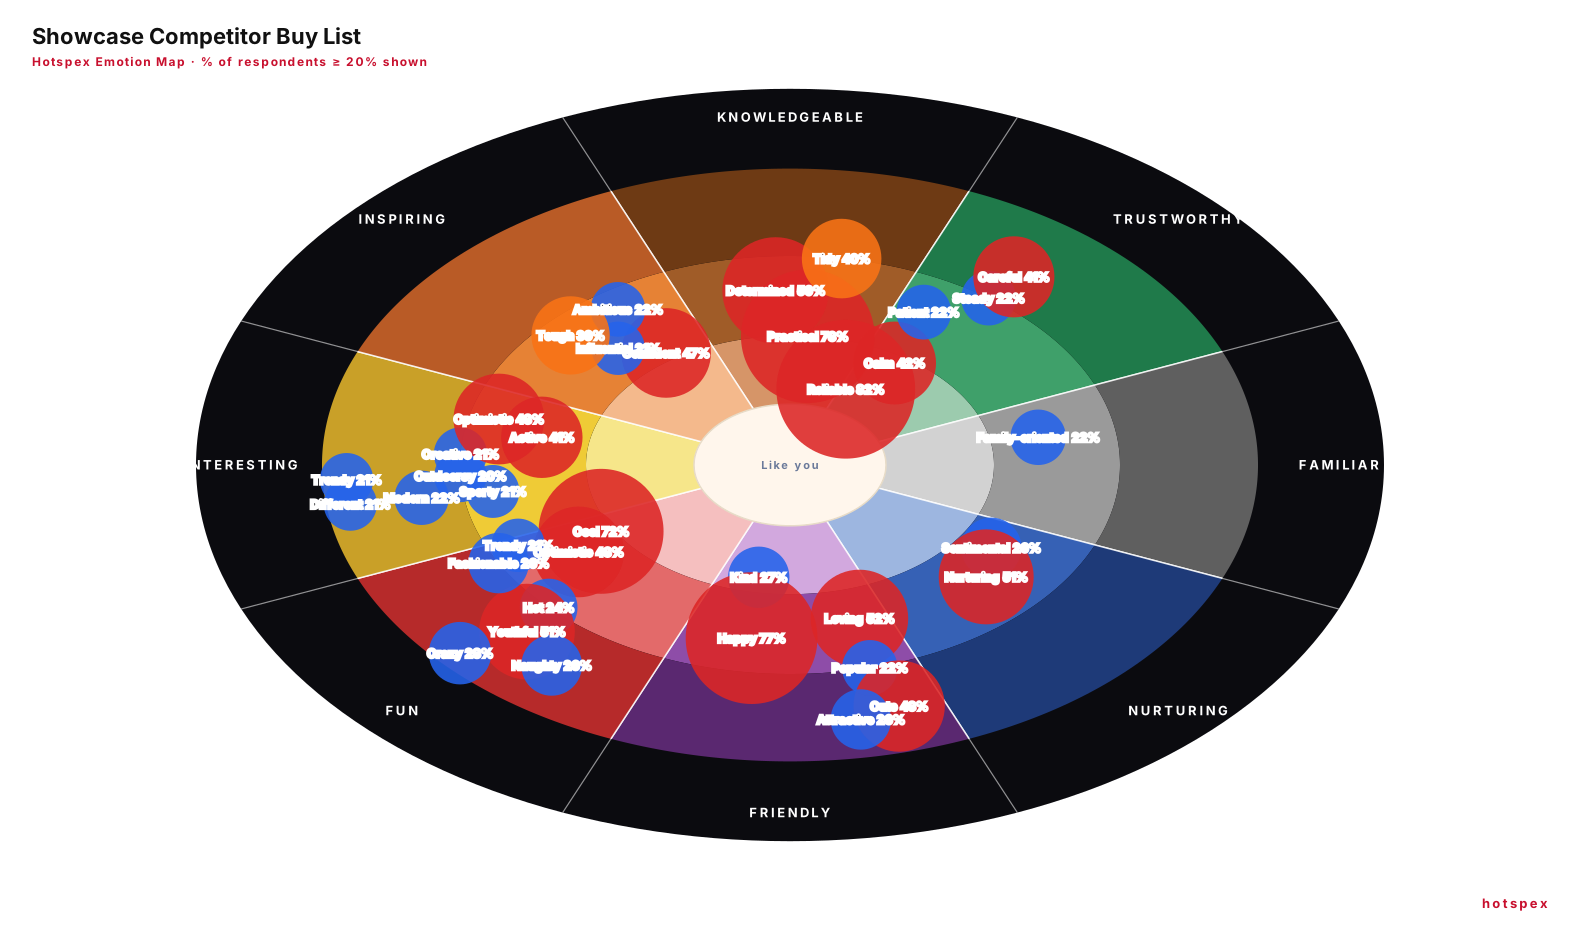
own core emotions — and scored on the connection it owns. Below is the actual wheel for the whole
buy list, then where it's crowded and where the white space is.
The 500-item buy list aggregated onto the 8-zone Hotspex Personality Wheel. Heat = share of the list firing each core emotion (blue <30% · orange 30–39% · red ≥40%).
Where the buy list lives — by Hotspex zone
White space — under-served, high-conversion zones
Architecture
A four-layer pipeline
01
Ingestion
TikTok Research API + Instagram Graph API, decoupled behind a queue. Rate-limit backoff, token refresh, sponsored-post and boycott-sentiment filtering before anything is scored.
→
02
Trend scoring
Per-product velocity and acceleration across three windows, with a smoothed denominator and a cross-platform convergence score that penalises single-platform flukes.
→
03
Emotion mapping
Each product placed on the Hotspex Emotion Map, scored on the dominant driver it fires — the predictive layer no trend tool has. This is what separates a fad from a repeat-purchase.
→
04
Idea Score
Trend momentum and emotional connection blend into one ranked buy list, weighted toward emotion because that's what converts the impulse purchase.
The business case
Why this beats buying a trend feed
Anyone can buy a trend dashboard. They all surface the same viral products. The edge is the
emotional layer — knowing why a product will convert, not just that it's trending.
The Showcase gap
Showcase merchandises on "what's hot." That's a trend signal everyone sees. A buy list ranked on trend and emotional pull lets you out-select them on the products that actually repeat-purchase, not just the ones that spike.
The wedge
Trend tools (Spate, Trendalytics, Exploding Topics) see the same viral gadgets. Only the Hotspex Emotion Map tells you which driver a product owns and whether that driver is over-supplied — turning a buy list into a portfolio strategy.
Monetization
Sell the ranked buy list as a quarterly merchandising service ($25–75K) — highest margin, plays to interpretation not raw data. An always-on API feed ($80–150K/yr) is stickier but exposes the proxy / data-broker margin trap.
The verdict
Durable value sits in the emotional interpretation, then the product ontology, then the trend math. Sell which products will convert and why, not a feed of what's trending. That's the moat Showcase can't copy.